ER Diagram: Introduction
- An Entity-Relationship Model is generated through ER Diagram i.e. known as Entity Relationship Diagram which constitutes various symbols with the help of which entities, attributes, and relationships are represented diagrammatically.
- Each of these components has a separate notation. Let’s discuss them together and later you can have your knowledge check through this test.
1. Entity: The entity is an ER Diagram is denoted through a rectangle. These rectangles are named according to the names of entities.
Entity
For example: Let the entities be Company, Course, Class, and Loan. Then they will be represented as :
Entity Example
2. Weak Entity: When attributes of an entity are not capable of determining the entity uniquely, it is called a weak entity. The weak entity in an ER Diagram is denoted through a double rectangle.

Weak Entity
For example: In a bank, the bank branch can be deduced as a weak entity as its attributes are not enough to determine it uniquely.

Weak Entity Example
3. Relationship: The relationship in an Entity Relationship Diagram is denoted through a diamond.

Relationship
For example: A person works in a company can be described using a relationship as :
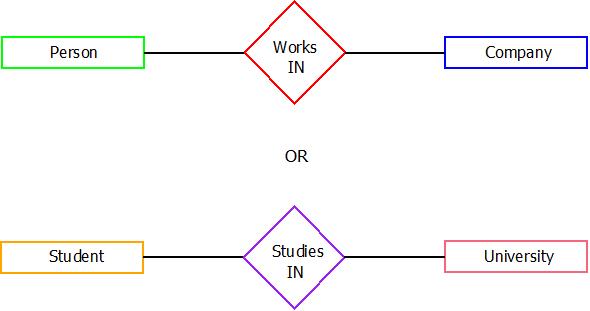
Relationship Example
4. Attributes: An Attributes in an ER Diagram are denoted through an ellipse.
Attribute
For example: A university acting as an entity can have multiple attributes like name, location, courses, colleges, etc.
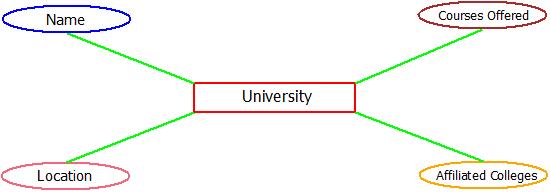
Attribute Example
5. Key Attribute: The key attribute is a type of attribute which alone can determine the entity uniquely. These are denoted through an ellipse with an underline.

Key Attribute
For example: A bank customer can be uniquely identified through his/her account number.
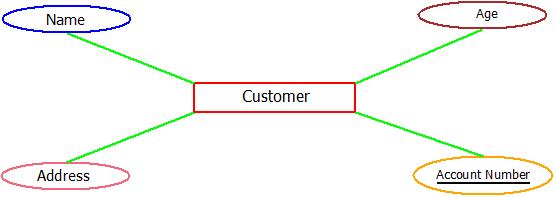 Key
Attribute Example
Key
Attribute Example6. Multi-valued Attribute: Multi-valued attributes in an Entity Relationship Diagram are denoted through the double ellipse.

ER Diagram: Multi-Valued Attribute
For example: An account holding customers of the bank can have multiple emails, multiple mobile numbers, and even multiple addresses(Permanent and Corresponding). They can be termed as multi-valued attributes.
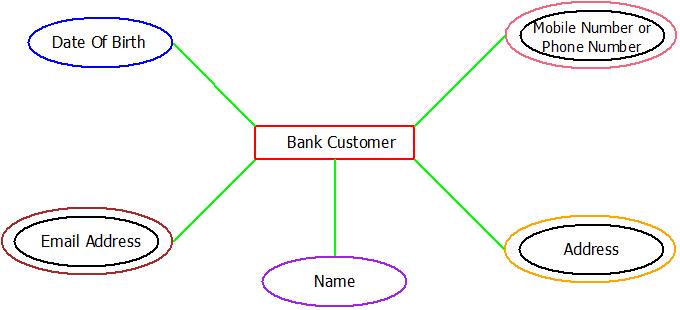
Multi-Valued Attribute Example
7. Composite Attributes: A Composite attributes in an Entity Relationship Diagram are denoted by the linked ellipse.
 ER Diagram:
Composite Attribute
ER Diagram:
Composite AttributeFor example: Let the name of a person(First Name + Middle Name + Last Name).

Composite Attribute Example
8. Derived Attribute: The Derived attributes in an ER Diagram(Entity Relationship Diagram) are represented using dashed ellipse.

ER Diagram: Derived Attribute
For example: Think of a class having some students. Each of them can have their name, address, and age. We can derive the average age of the student from already present data in the database.
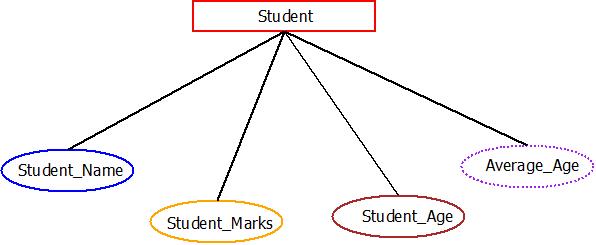
Derived Attribute Example
9. Total Participation of Entity in Relation: In this type, every entity is fully involved and linked in the relationship and this participation is denoted using double lines.
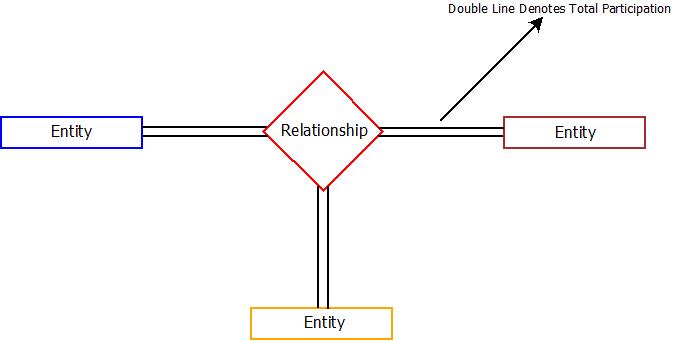
Total Participation
10. Partial Participation of Entity in Relation: As the name suggests, some of the entities participate in the relationship fully and some of them participate partially. Partial relation in ER Diagram is denoted using a single line.
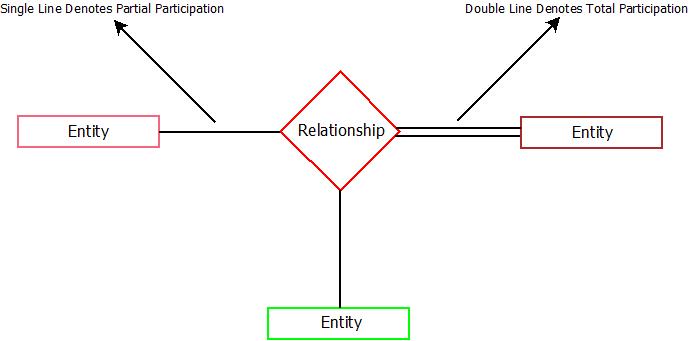
Partial Participation